Vaccine Updates, Infographics, Post-Holiday Covid Situation Report, and More
The Science & Society Newsletter | Dec 2, 2020
Global Numbers
63,359,632 cases
1,470,769 deaths
40,637,940 recovered
—Center for Systems Science and Engineering, Johns Hopkins University
Key Developments
Pandemic expands extreme poverty: 1 in 33 people will require humanitarian assistance in 2021—that’s a 40% jump from 2020, according to the UN’s Global Humanitarian Overview 2021. Thomson Reuters Foundation
SARS-CoV-2 may have been circulating in the US as early as December 2019, well before cases in China were publicly reported; a new analysis of US blood donations from December and January found antibodies to the virus in 106 out of 7,389 samples.
Black children are disproportionately affected by the rare COVID-related multisystem inflammatory syndrome, making up 34.4% of MIS-C cases in New York City but just 19.9% of pediatric COVID-19 hospitalizations, a new JAMA paper found. CIDRAP
How a bidding war for COVID-19 nurses hurts the pandemic response – Undark
Dr. Scott Atlas resigns from Trump administration – CNN
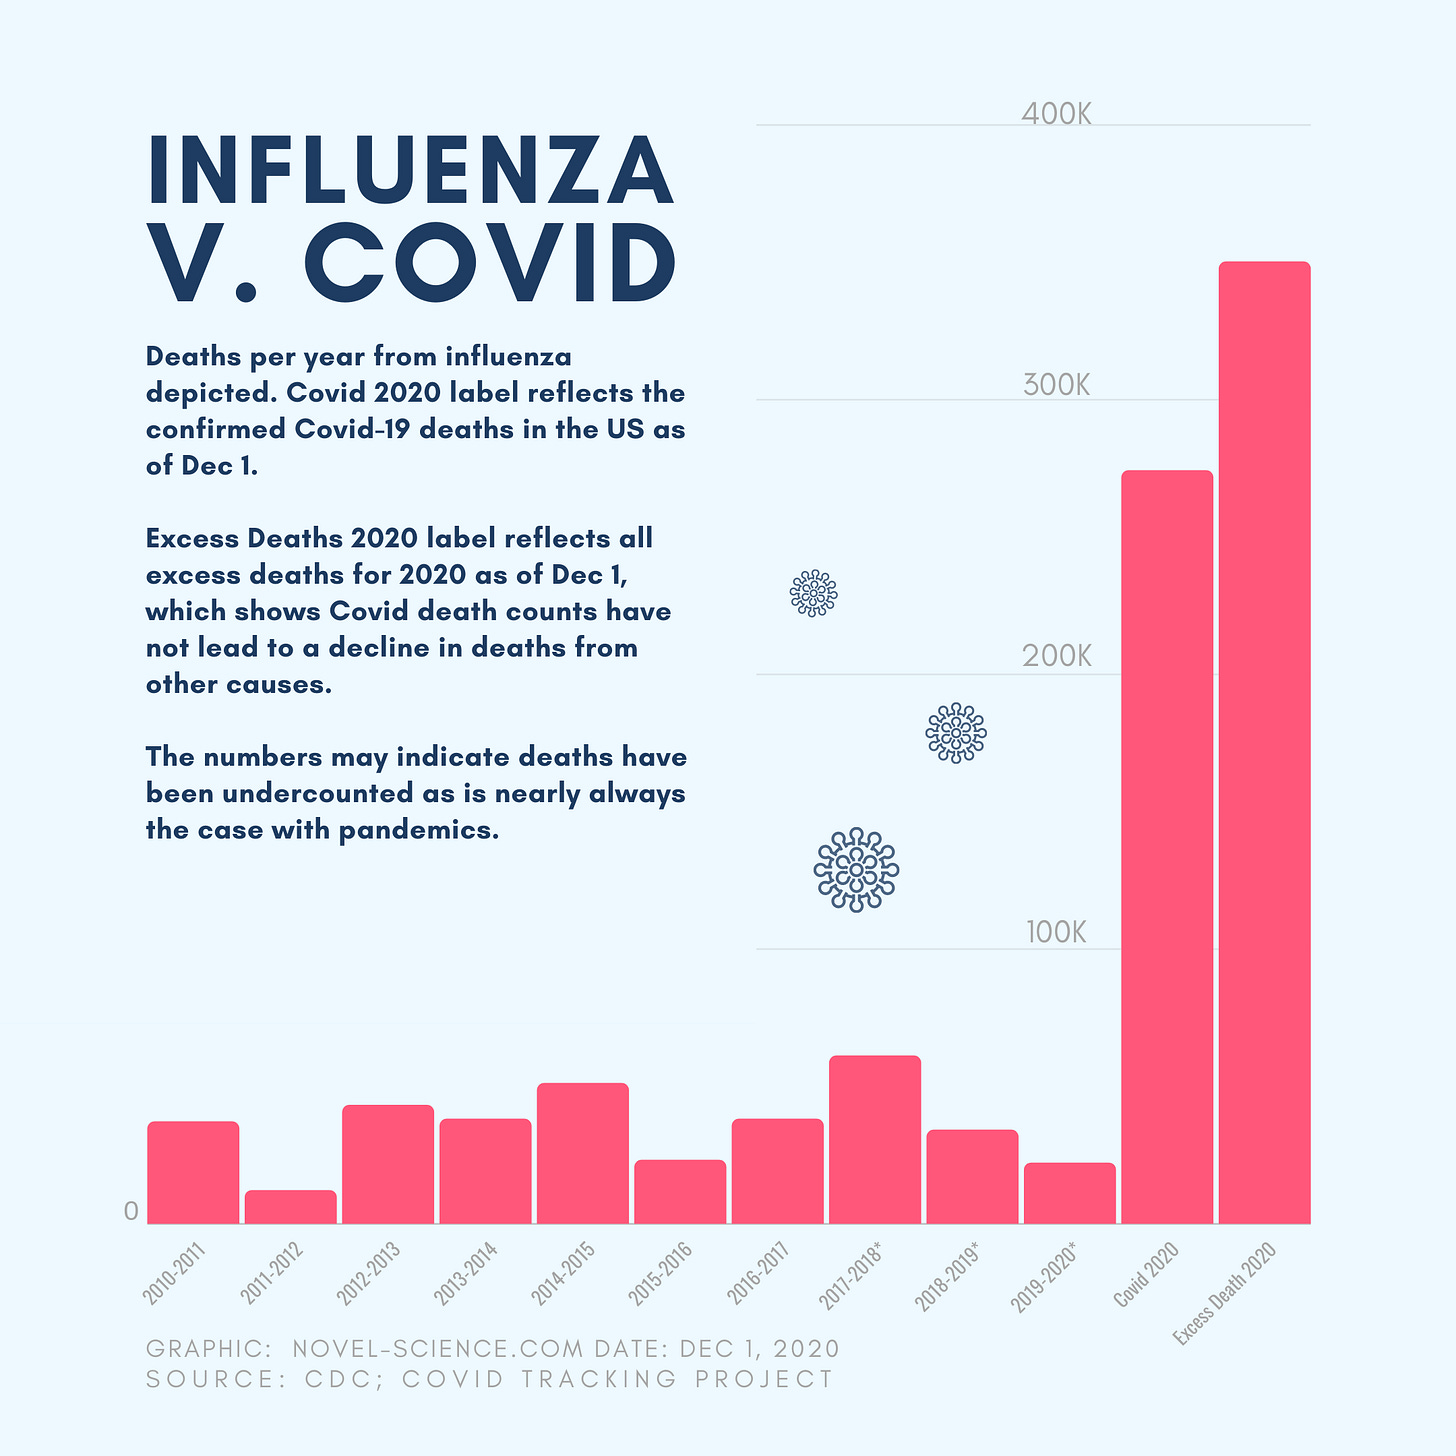
Recent Data Visualizations from Novel Science
EPI UPDATE
UNITED STATES
The US CDC reported 13.30 million total cases and 266,051 deaths. The US surpassed 13 million cumulative cases on November 28. From the first case reported in the US on January 22, it took 96 days to reach 1 million cases.
From there:
1 to 2 million- 44 days
2 to 3 million- 27 days
3 to 4 million- 15 days
4 to 5 million- 17 days
5 to 6 million- 22 days
6 to 7 million- 25 days
7 to 8 million- 21 days
8 to 9 million- 14 days
9 to 10 million- 10 days
10 to 11 million- 7 days
11 to 12 million- 5 days
12 to 13 million- 7 days
The US reported 12,999,624 cases on November 27, and it is likely that the US would have surpassed 13 million cases a day earlier, if not for delayed reporting over the Thanksgiving holiday.
US VACCINE ALLOCATION
As vaccine candidates get closer to receiving Emergency Use Authorizations (EUAs) under the US FDA, officials and health experts are working diligently to determine how the first doses should be allocated. Officials from the White House’s Operation Warp Speed announced that the initial doses purchased by the US government will be allocated to states based on population. From there, the current plan is for states to determine how best to allocate their allotted vaccines to individuals.
The White House says the plan is devised to make things simple. That may be true but they could easily outsource to people willing and able to do the difficult work of distributing doses strategically. Vaccines, given to specific populations or in certain locations, can maximize the impact of the limited vaccine doses.
Any extra benefit could favor Americans eager to return the “before-times.”
Last week, the CDC’s Advisory Committee on Immunization Practices (ACIP), which issues recommendations for a variety of vaccines used in the US, presented its preliminary guidelines regarding the “phased allocation” of SARS-CoV-2 vaccines.
The preliminary guidance indicates that the highest priority (Phase 1a) should include frontline healthcare workers and residents in long-term care facilities.
Phase 1b would expand access to other essential workers, including in the education, food and agriculture, public utility, law enforcement, and corrections, emergency response (e.g., firefighters), and transportation sectors.
And Phase 1c would include those at elevated risk for severe COVID-19 disease, including those with underlying health conditions and those aged 65 and older.
The Phase 1 plan received general agreement from the ACIP members, but additional data and discussion were needed.
From the Covid Tracking Project:
The project has written about the reasons data around Thanksgiving may not be reliable for several days or longer. I wrote in a Covid briefing earlier this week that we should expect the data to possibly decline before coming back up and rising.
Be skeptical of the data for several days or more after the holiday weekend.
The Covid Tracking Project shared this graph showing Labor Day as an example of how irregularities in our schedules affect the data.
Big Picture
“Our daily update is published. States reported 1.3 million tests, 177k cases, and 2,473 deaths. There are 99k people currently hospitalized with COVID-19 in the US, a new record.”
Hospitalization
“As the number of current hospitalizations approaches 100k people, daily deaths have rebounded, after a post-holiday drop. We saw the same pattern after Labor Day.”
”Indiana and Nevada are now reporting more than 500 currently hospitalized per million people, along with South Dakota. For reference, the highest value of hospitalizations per million people we've seen was 968 in New York back in April.
A handful of states reported data for more than one day today, a result of data disruptions caused by the Thanksgiving holiday. CO, NJ, TX, WA, and WY only published partial updates today.”
Zooming Out It’s Clear November Was Not A Great Month
Alabama Public Health surveyed people who were infectious over the two weeks from Nov 6 to Nov 21 and asked them which social gatherings they had attended. This word cloud depicts the result. Size represents the frequency a word was reported by people testing positive for Covid.
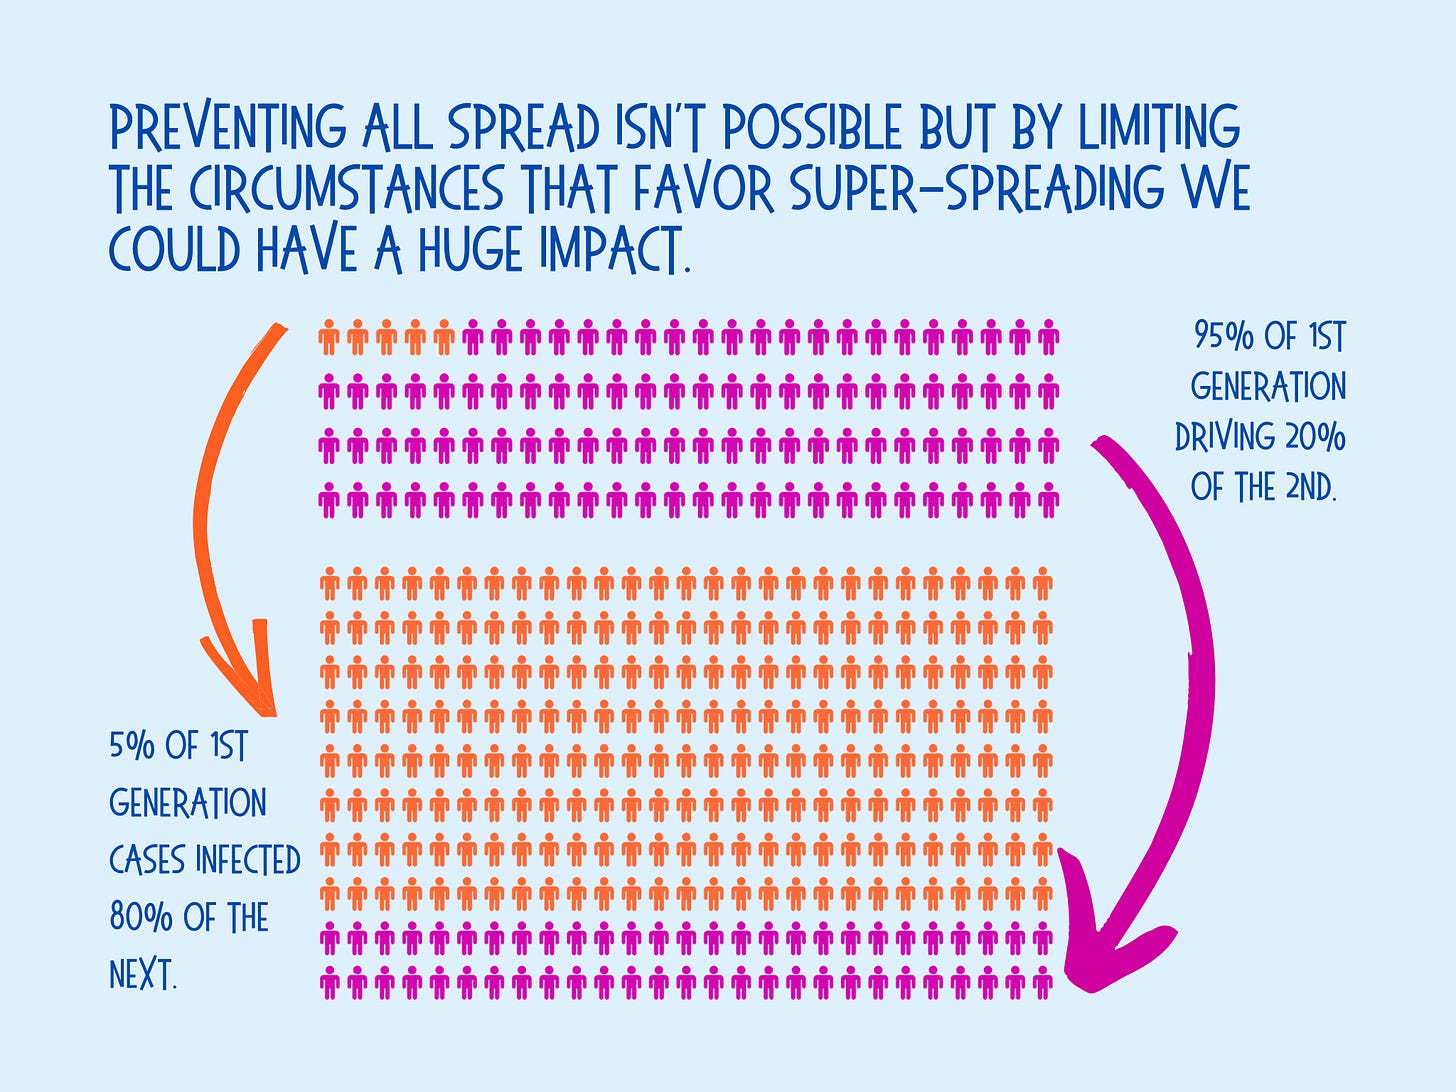
Middle-School to High-School Infographic Explainer:
What Does it Mean to Be a Super-Spreader and How Can Understanding This Help Us Beat the Virus?
The best way to avoid super-spreading events is to avoid situations that frequently become the setting for super-spreader events.


